TL;DR
- Retail cannibalization happens when a new store draws revenue away from your existing ones instead of capturing new demand.
- Most brands discover it 12–18 months after opening, when the damage is already done.
- The root cause is poor site selection, not enough analysis of catchment overlap and consumer demand before committing.
- Kentrix’s StorePlannix quantifies cannibalization risk at the site level before you sign the lease, with a cannibalization ratio, a store-by-store impact breakdown, and a net portfolio contribution number.
- Geomarketeer complements this with location intelligence across 920 million Indian households, helping brands understand true market potential before expanding.
What Is Retail Cannibalization?
Retail cannibalization, also called store cannibalization or market cannibalization is what happens when a new store in your network starts competing with your existing stores for the same customers.
The new store opens. Sales look decent. But two stores nearby start losing revenue. The customers who are walking into the new outlet are largely the same customers who were visiting your older locations. You haven’t grown your market. You’ve just split it.
It is one of the most common and least discussed risks in retail network expansion.
Example of Retail Cannibalization
Imagine a consumer electronics brand with a strong-performing store in Malad West, Mumbai. The store does ₹9.88 crore a month. The expansion team identifies a promising site in a township node 1.1 km away. The new location looks good on paper with high footfall, growing residential density, no direct competitor.
The store opens. Three months in, revenue at Malad West starts sliding. By month six, it is down ₹46.5 lakhs a month. A second nearby store has absorbed another ₹9.87 lakh hit. The new store’s “standalone” revenue of ₹2.09 crore a month sounds healthy. But its actual net contribution to the portfolio after accounting for what it has taken from existing stores is just ₹1.52 crore. That is 27% below the standalone projection.
The expansion did not grow the network. It redistributed it.
Why Retail Cannibalization Is Harder to Spot Than You Think?
Most expansion teams in India are working on tools that were not meant to catch cannibalisation.
Trade area mapping draws a radius around a planned site and checks for competitor presence. It does not model the behavioural overlap between your own stores. Generic demographic data tells you how many households exist in a catchment. It does not tell you how much of that demand is already being served by a store you own 800 metres away.
The result is an expansion decision built on standalone site potential which always looks better than the full network picture.
This is not a niche problem. Retail brands in India expanding aggressively into Tier 1 suburbs and Tier 2 cities are particularly exposed to it, because the temptation is to follow footfall signals without understanding whether that footfall represents new demand or captured demand.
When Does Cannibalization Happen Most?
- When two stores from the same brand sit within overlapping catchment areas
- When a new store in an urban cluster targets the same income segment as an existing nearby outlet
- When expansion is driven by real estate availability rather than demand whitespace
- When category mix at the new store mirrors the existing store too closely for the local market
How Kentrix.ai Solves the Retail Cannibalization Problem?
Kentrix approaches cannibalization as a pre-opening decision problem and not a post opening diagnostic. The goal is to quantify the risk before any capital is committed.
StorePlannix – Cannibalization Analysis Before You Open
StorePlannix is Kentrix’s AI-powered new store planning platform. For every site in your expansion pipeline, it runs a cannibalization and network lift analysis that maps your existing portfolio, calculates catchment overlap with each nearby store, and produces a predicted revenue impact.
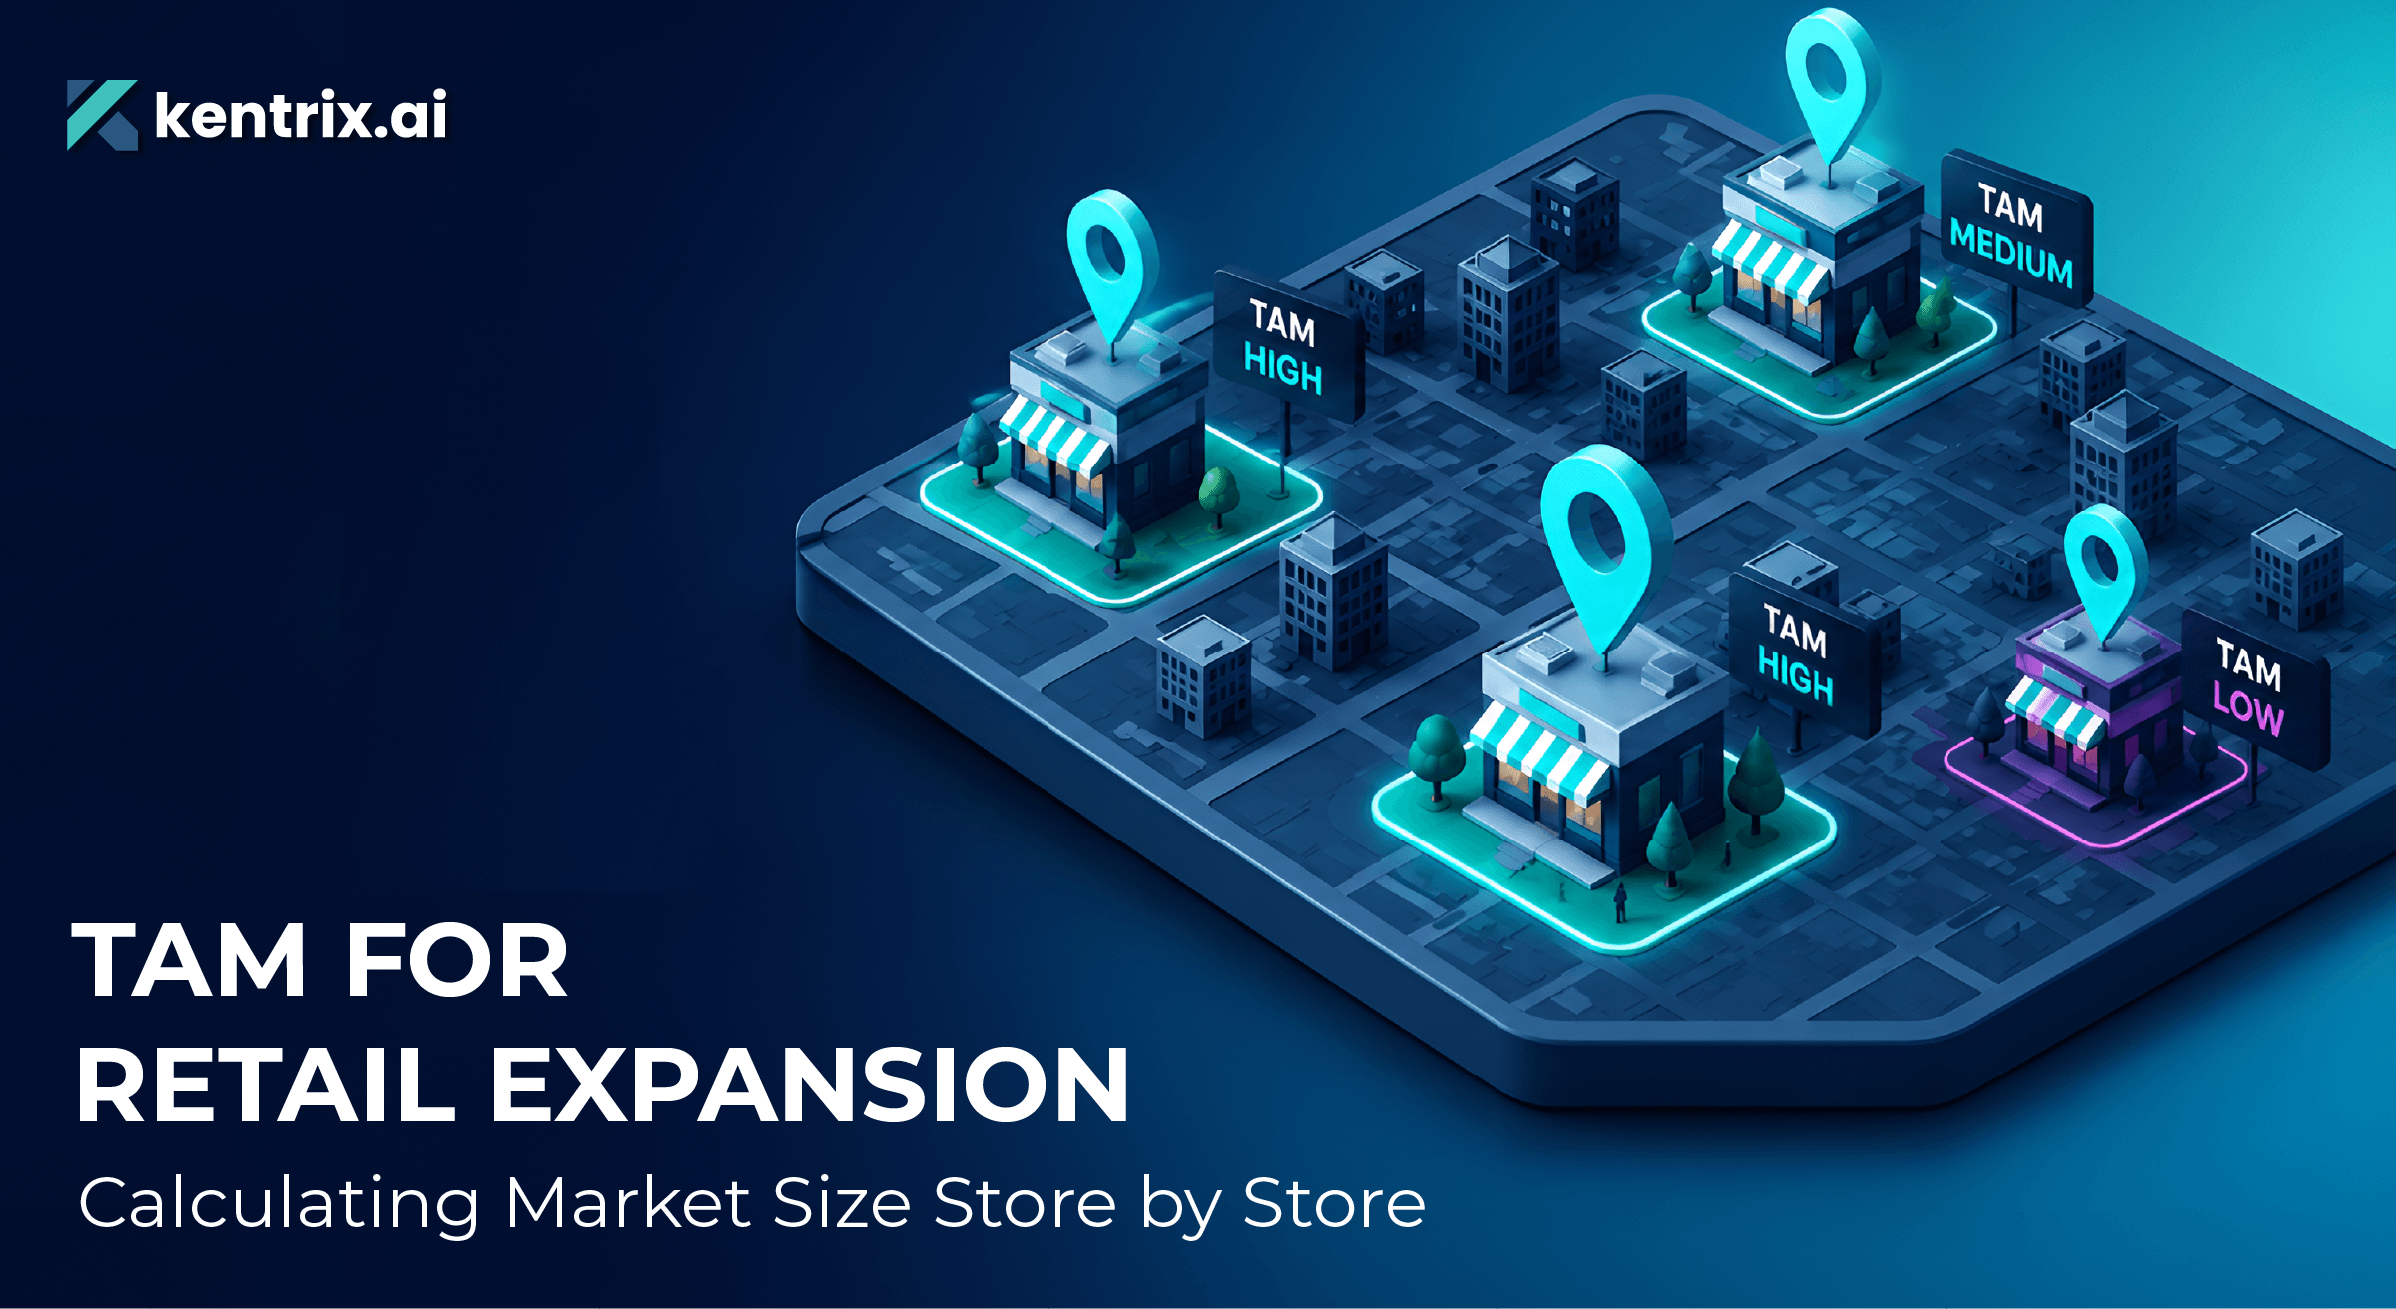
The output is precise. If a planned site carries a 27% cannibalization ratio, StorePlannix surfaces that number, names the stores that will be affected, and quantifies the revenue change at each of them. The net portfolio contribution, the number that actually matters for the expansion decision is calculated separately from the standalone site forecast.
This distinction is important. A site with a ₹2.09 crore standalone revenue forecast and a 27% cannibalization ratio is a materially different investment proposition than a site with the same standalone forecast and zero cannibalization. Most expansion teams never see that distinction because they are looking at site scores, not the overall impact on the portfolio.
StorePlannix also identifies the positive scenario, sites where a new store is projected to lift the revenue of nearby outlets by bringing new footfall into a market the network was not yet fully serving. These are the sites worth prioritising. A new store projecting zero cannibalization and a 5% lift on its nearest neighbour, adding ₹86.6 lakhs in incremental network revenue, is a fundamentally stronger case than a same-revenue site that quietly erodes two existing stores.
Geomarketeer – Understand True Market Potential
Cannibalization analysis does not exist in isolation. It depends on a clear picture of where real demand exists and where it has already been captured.
Geomarketeer, Kentrix’s location intelligence tool provides that picture. Powered by granular data on 920 million Indian households, it surfaces consumer density, income profiles, category demand signals, and competitive presence at a building level.
Expansion teams use it to identify genuine whitespace, markets where demand exists but your network has not yet reached versus markets that look opportunity-rich but are already well-served by your existing stores.
What Good Retail Expansion Planning Looks Like?
A well-planned expansion site evaluation should answer five questions before any commitment is made:
- What will this store make? A month-by-month revenue forecast, not a single annual estimate.
- How fast will it ramp? A ramp-up trajectory that accounts for the specific catchment and the season of opening.
- What will it cost my existing stores? A store-by-store cannibalization impact, not a directional flag.
- What is driving the prediction? A feature-level attribution, which variables are responsible for the forecast, and which are in the retailer’s control.
- What should the store open with? A category mix recommendation tied to the specific catchment, not a network-wide template.
StorePlannix surfaces all five. The cannibalization analysis is one module in a five-module decision set that covers the full new store planning problem.
FAQs
How do you measure retail cannibalization?
The most precise method is a catchment-level overlap model that calculates the predicted revenue impact on each existing store near a planned site. A cannibalization ratio expresses this as a percentage of the new store’s standalone forecast that is likely to come at the expense of existing stores.
Can the market cannibalization in retail be prevented?
Yes, but only before you open. Once a store is operational, the options narrow to operational adjustments and category differentiation. The prevention window is the pre-opening planning phase, where site selection and portfolio analysis can flag high-risk locations before capital is committed.
What is a good cannibalization ratio for a new store?
There is no universal threshold, it depends on the retailer’s margin profile and expansion strategy. But any site where cannibalization exceeds 20–25% of the standalone revenue forecast warrants a detailed review of whether the net portfolio contribution justifies the opening.
How does StorePlannix by Kentrix handle cannibalization analysis?
StorePlannix maps every existing store near a planned site, calculates catchment overlap using household-level consumer data, and produces a predicted revenue impact, positive or negative for each neighbour. The output includes a cannibalization ratio, a store-by-store breakdown, and a net portfolio contribution figure that accounts for the full network impact of the new opening.