A city’s TAM tells you if the city is worth entering. It does not tell you whether a specific 500-metre catchment on the third floor of a mall in that city can support a store, what that store’s category mix should look like, or whether it will quietly cannibalize the location you already run two kilometres away. Those are store-level questions, and they need a store-level number.
This is the gap most retail expansion plans fall into. They size the market once, at the top, and then treat every site inside that market as roughly equivalent. It rarely is.
Why city-level TAM isn’t enough for store decisions
Retail demand is not distributed evenly across a city. A city with a large, TAM-friendly population can still have most of its target customers concentrated in a handful of neighborhoods, while the rest of the city looks nothing like the average used to calculate that TAM.
Two sites in the same city, sometimes the same few kilometres apart, can have very different addressable demand once you account for:
- Household income and spending behavior specific to that catchment, not the city average
- Footfall quality, how many people actually pass a site versus how many fit the target profile
- Competitive density, how much of that catchment’s demand is already served by an existing player
- Overlap with a retailer’s own nearby stores, which shrinks the incremental market available to a new one
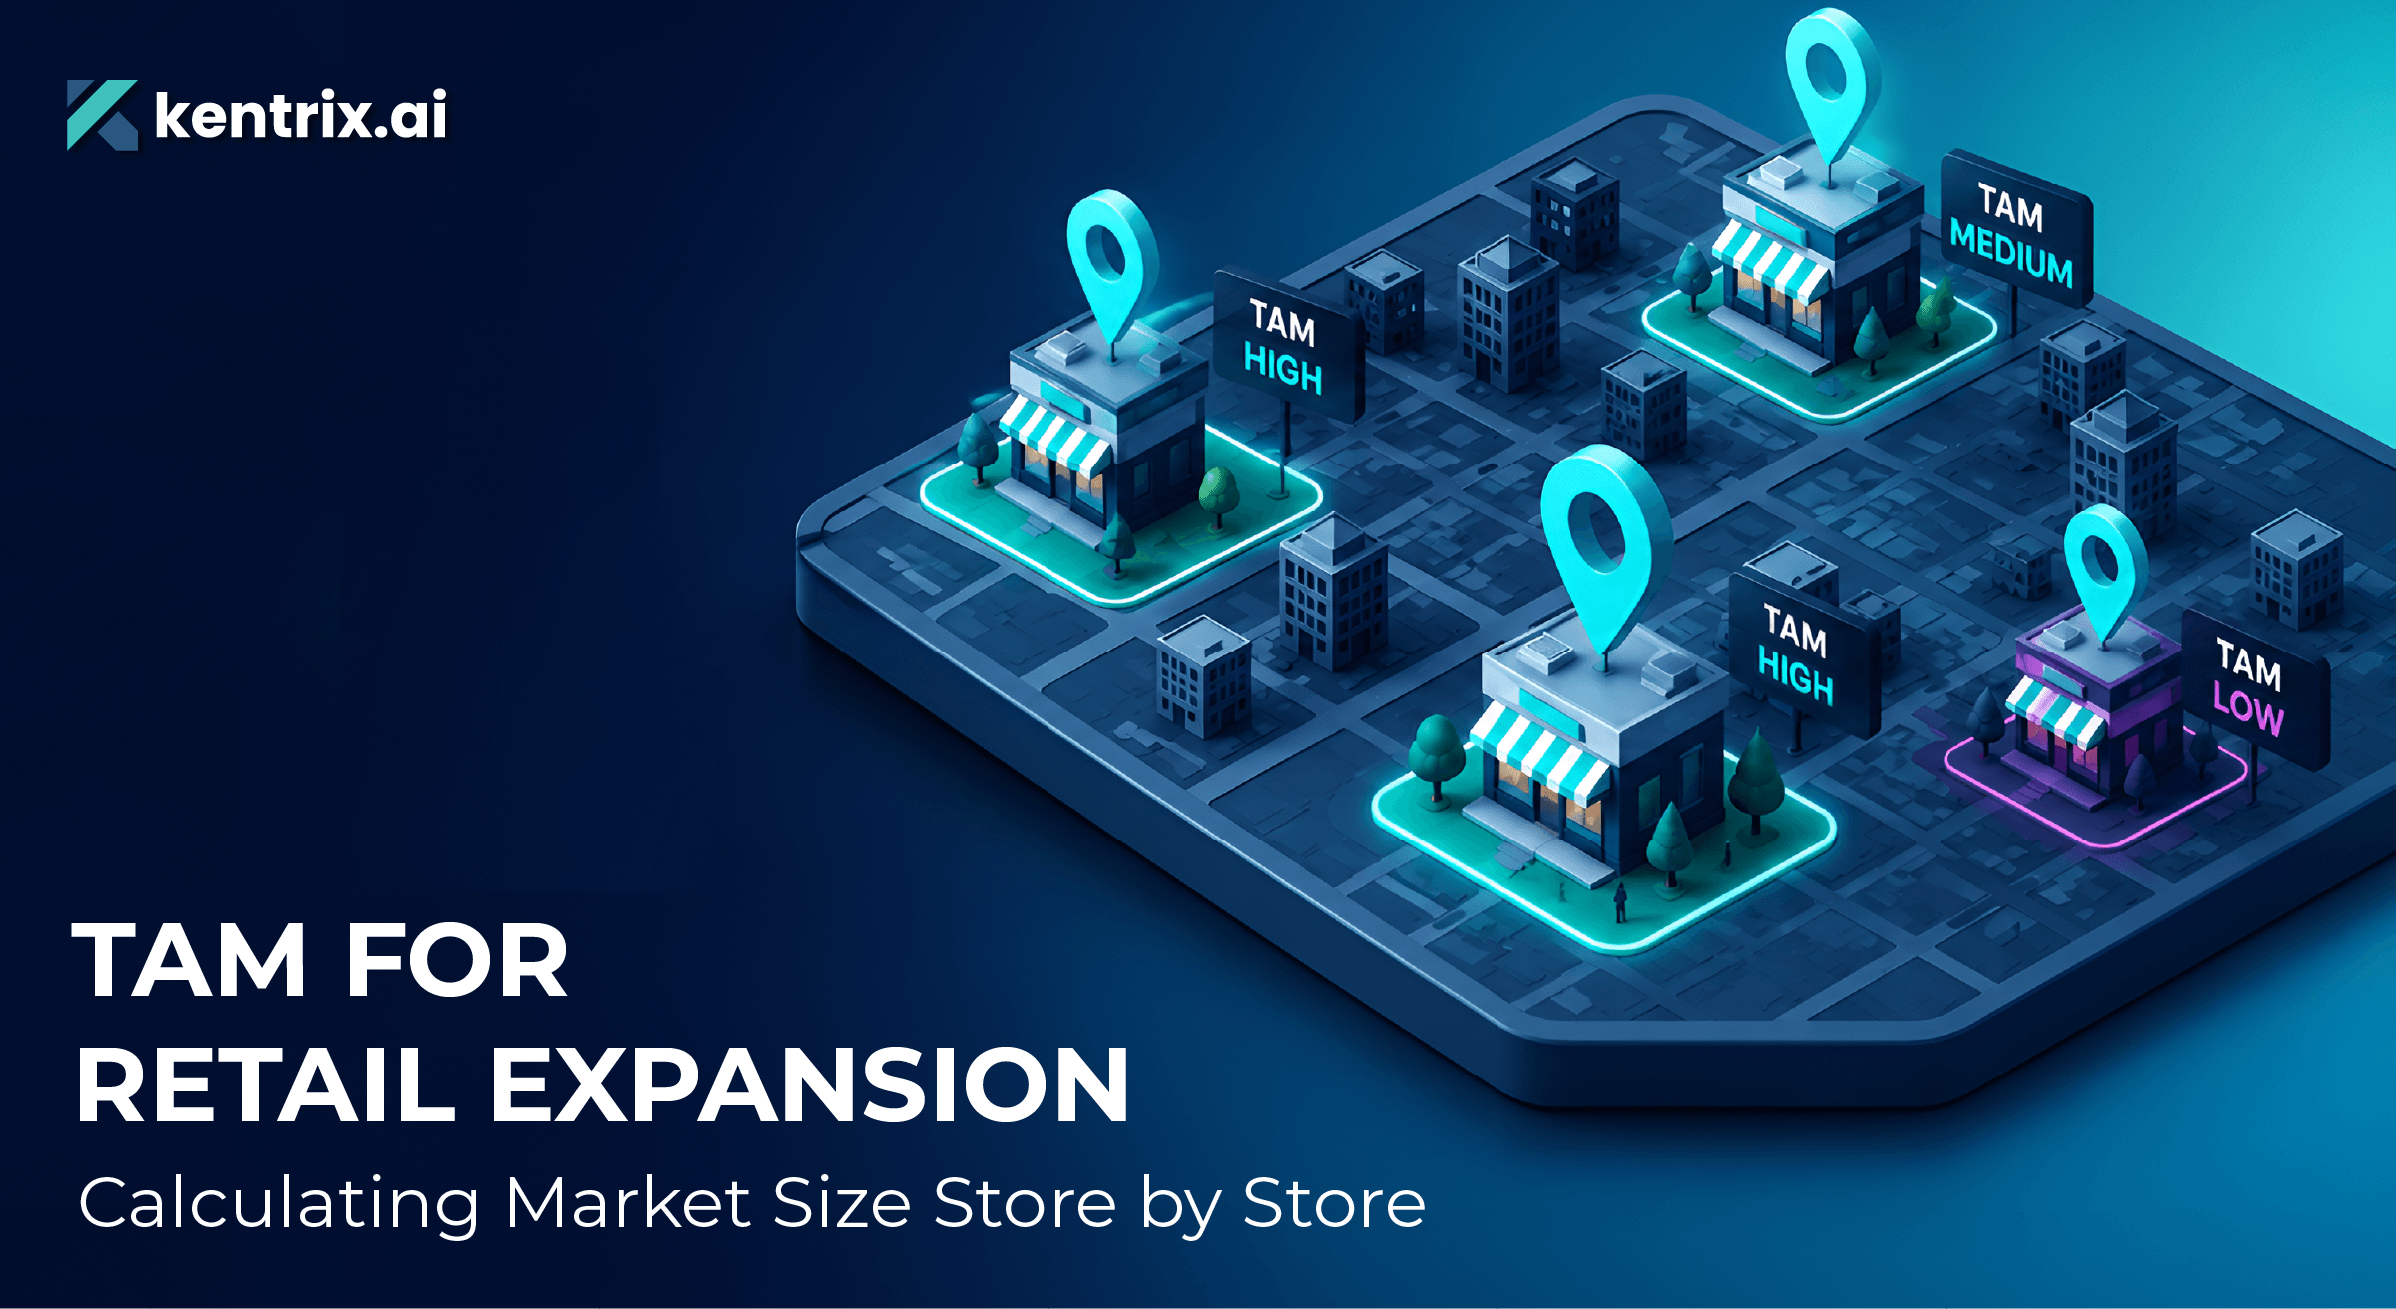
A city-wide TAM answers “should we enter this city.” It cannot answer “should we open here, at this specific site, this year.” That second question needs the TAM recalculated at the catchment level, for every site under consideration.
What store-by-store TAM calculation actually involves
Calculating TAM at the store level means running the same core logic as a citywide TAM – total addressable customers times spending potential but doing it independently for each catchment, not applying one number top-down.
In practice, that means for every candidate site:
- Defining the true catchment, not a fixed radius. Drive time, walkability, and competing points of interest all shape how far a store’s real catchment extends, and it’s rarely a neat circle on a map.
- Counting the addressable households within that catchment. Using demographic and spending data granular enough to reflect the specific streets involved, not a city or pincode-level average.
- Adjusting for existing competition, so the number reflects demand that’s genuinely available, not demand already captured by a competitor operating in the same catchment. It gives a complete picture of the real whitespace.
- Adjusting for the retailer’s own network, so a new site’s addressable market accounts for overlap with stores already open nearby, rather than treating each site as if it were entering an empty market.
- Layering in category-specific demand, since a catchment’s TAM for electronics looks nothing like its TAM for groceries, even at the same address.
Done properly, this turns one city-level TAM figure into a ranked, comparable TAM for every site in an expansion pipeline, which is a fundamentally more useful output for a real estate or expansion team than a single market-size slide.
How Geomarketeer builds the foundation?
This kind of granular calculation depends entirely on the data underneath it, and that’s where Geomarketeer does the groundwork. It’s built on building-level consumer data across 920 million Indian households, refreshed quarterly, so a catchment’s demand profile reflects current behavior rather than a stale census figure.
For TAM purposes specifically, Geomarketeer calculates addressable market down to building-level precision or a defined drive-time radius, factoring in both consumer density and existing retailer presence in that catchment. That’s the difference between a TAM number based on “this city has X million people” and one based on “this specific 5-minute drivetime has this many households matching your target profile, and here’s how much of that demand is already served.”
Geomarketeer also runs whitespace analysis alongside the TAM calculation, which matters because a catchment’s total demand and its actually available demand are two different numbers. A site can sit inside a large TAM and still be a poor choice if most of that demand is already locked into a competitor down the street.
Where StorePlannix takes it from there
A precise, catchment-level TAM tells a retail team how much demand exists at a site. It doesn’t tell them what a specific store will actually make, how fast it will get there, or what it will cost the rest of the network. That’s where StorePlannix picks up.
StorePlannix takes the catchment data underlying the TAM calculation and runs it through a trained revenue prediction model, evaluated across 25 algorithm variants and validated on held-out sites, to produce a site-level monthly revenue forecast and a 24-month ramp-up trajectory. A site gets classified as Fast Ramp, Medium Ramp, or Slow Ramp based on how comparable catchments have historically built revenue, which turns a TAM figure into an actual cash-flow expectation.
It also directly answers the question a city-level TAM glosses over: cannibalization. StorePlannix quantifies the exact revenue impact a new site will have on every existing store nearby, expressed as a single cannibalization ratio. A site with a large addressable TAM but a high cannibalization ratio can end up contributing less net revenue to the network than a smaller-TAM site in a genuinely underserved catchment. Without that adjustment, a store-by-store TAM exercise still risks overstating the real opportunity.
On top of revenue and cannibalization, StorePlannix uses SHAP-based feature attribution to show exactly which variables, structural factors like household income or footfall density, versus controllable ones like SKU range and staffing, are driving each site’s prediction, and closes with a category mix recommendation calibrated to that specific catchment rather than a network-wide template.
Turning TAM into an expansion decision
Store-by-store TAM calculation is what separates an expansion plan built on a single market-size slide from one built on a ranked, comparable, defensible view of every site in the pipeline. Geomarketeer supplies the granular, building-level demand data that makes a catchment-specific TAM possible in the first place. StorePlannix carries that data forward into a revenue forecast, a cannibalization-adjusted network view, and an opening assortment plan, so the number a retail team plans against reflects what a site will actually deliver, not just what the city it sits in is theoretically worth.
For a retail chain with dozens of sites in its pipeline, that’s the difference between opening in market order and opening in the order that actually grows the network.
You can talk to our location intelligence experts to calculate store-level TAM for your expansion pipeline.